...
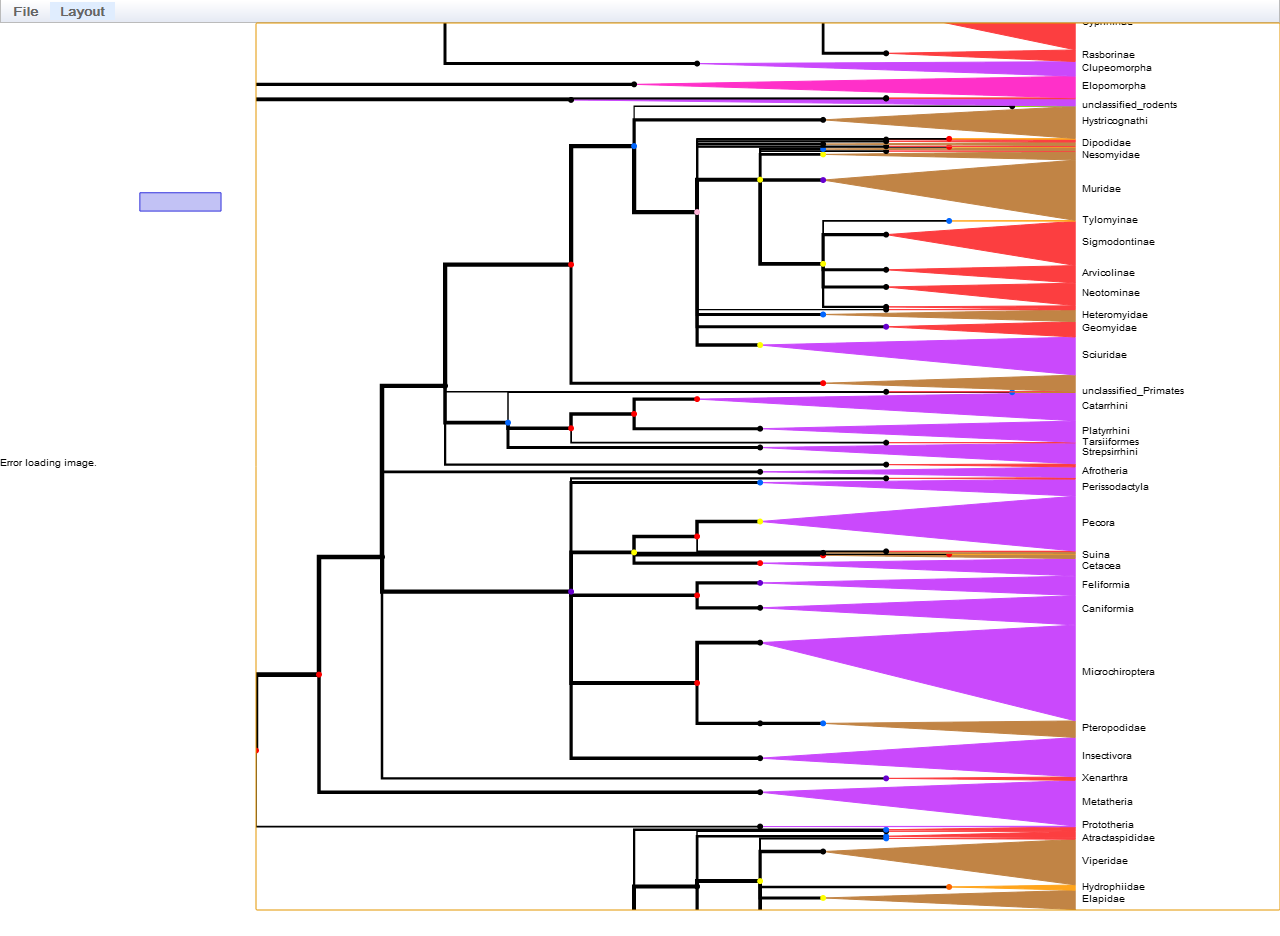
A portion of the NCBI tree in the cladogram layout
Now with color maps for continuous data! The 50K node sample tree with the collapsed subtree triangles colored by total number of nodes in the subtree. (Greener = more)

...
A portion of the NCBI tree in the cladogram layout
Now with color maps for continuous data! The 50K node sample tree with the collapsed subtree triangles colored by total number of nodes in the subtree. (Greener = more)